

Fixing a slow INP: making store pages respond faster
Slow INP usually comes from main-thread JavaScript, so fixing it means doing less work per tap and click. Here is how to find the cause and fix it on Shopify.
- Published
- 8 Nov 2026
- As of
- 24 Oct 2026
INP, or Interaction to Next Paint, measures how long a page takes to visibly respond after a tap, click or key press. It is the Core Web Vital the stores we measure miss most often. This guide is for merchants who want to know why it matters and developers who need to fix it on Liquid themes and headless builds.
Typical page load time (median LCP)
Show the data
| Shopify, Liquid theme | 1.8 s |
|---|---|
| Shopify, headless | 2.2 s |
| Salesforce Commerce Cloud | 2.4 s |
| Other and custom | 2 s |
What INP measures and why stores miss it
INP, short for Interaction to Next Paint, measures how long a page takes to respond visibly after someone taps, clicks or presses a key. Shopify's performance guidance puts it that way, and web.dev describes it as a responsiveness metric that looks at every qualifying interaction during a visit, not just the first. Hovering, zooming and scrolling are not counted. Think of the add to cart tap, the variant swatch, the menu button and the filter checkbox.
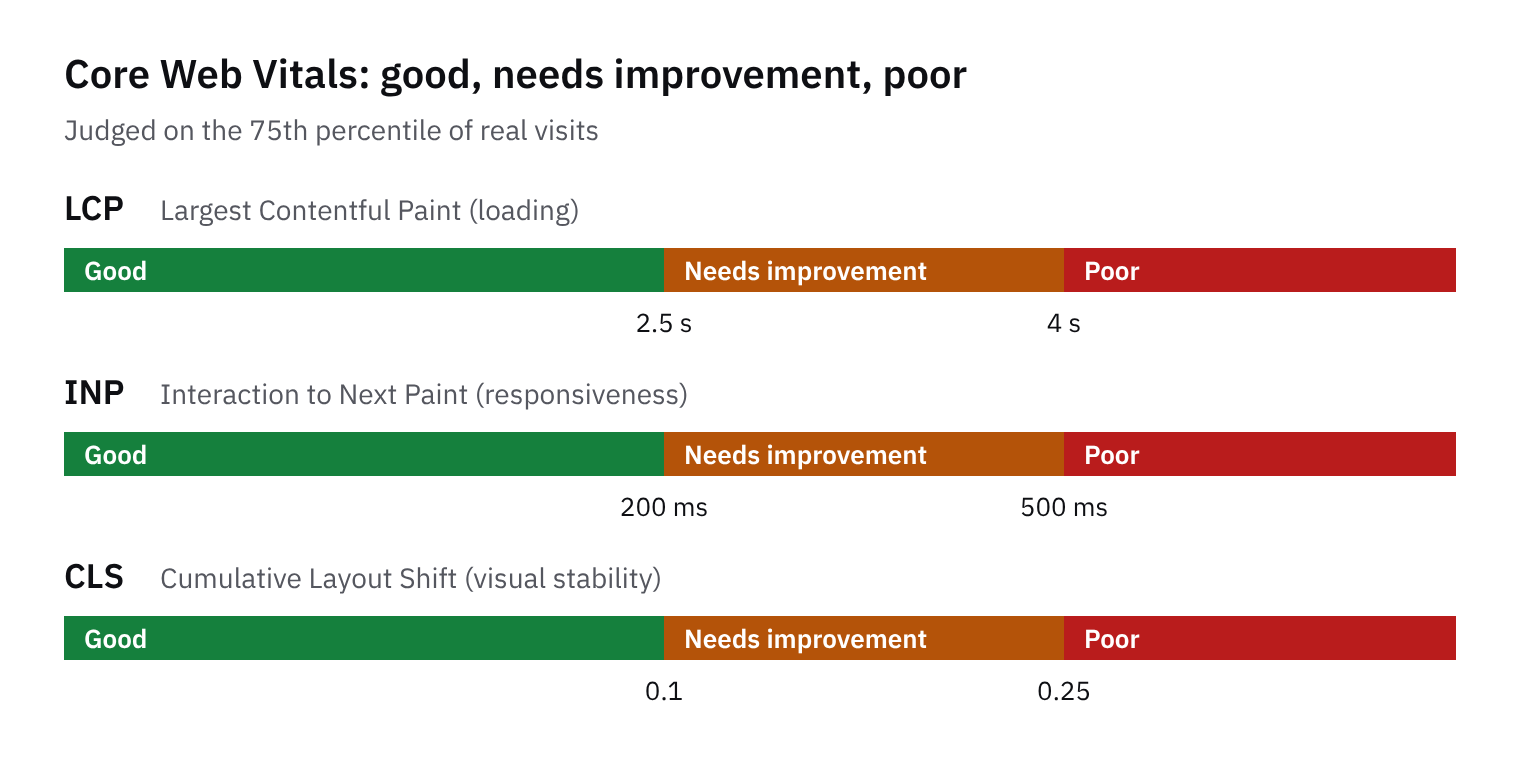
Google's good threshold is 200 milliseconds or less, and anything above 500 milliseconds counts as poor. web.dev recommends judging a page at the 75th percentile of real page loads, split across mobile and desktop. That means three in four visits need to be at or under the line, so a handful of fast test runs on your laptop tell you very little. INP also ignores one of the slowest interactions for every 50, so a single odd tap won't sink a page, but a pattern of slow ones will.
Here is the odd part. Among the stores we index, the typical Liquid theme store and the typical headless store both sit at a median INP of 150 ms, comfortably inside the good range. Yet a quarter of stores still miss the threshold. A median hides the tail: the stores that fail are the ones where something heavy lands on the main thread, the browser's single busy lane for scripts. Shopify's docs say main-thread work, usually JavaScript, is what makes INP slow.
Shoppers don't see a metric. They see a tap that seems ignored, then tap again, and sometimes trigger the action twice. That costs you trust at the exact moment they are trying to buy. Google also uses Core Web Vitals as a ranking signal, according to Shopify's docs, so it matters for visibility too. A practical first step is to check your own field data for the 75th percentile, then list which scripts run on your busiest templates. We cover the usual suspects next.
Where the delay comes from
Every interaction has three parts, and web.dev says the sum of them is the total interaction latency. First comes input delay, the wait before event handlers start. Then processing duration, while your handlers run. Last is presentation delay, until the browser paints the result. When a tap feels sluggish, one of those three is the culprit, and the fix differs for each.
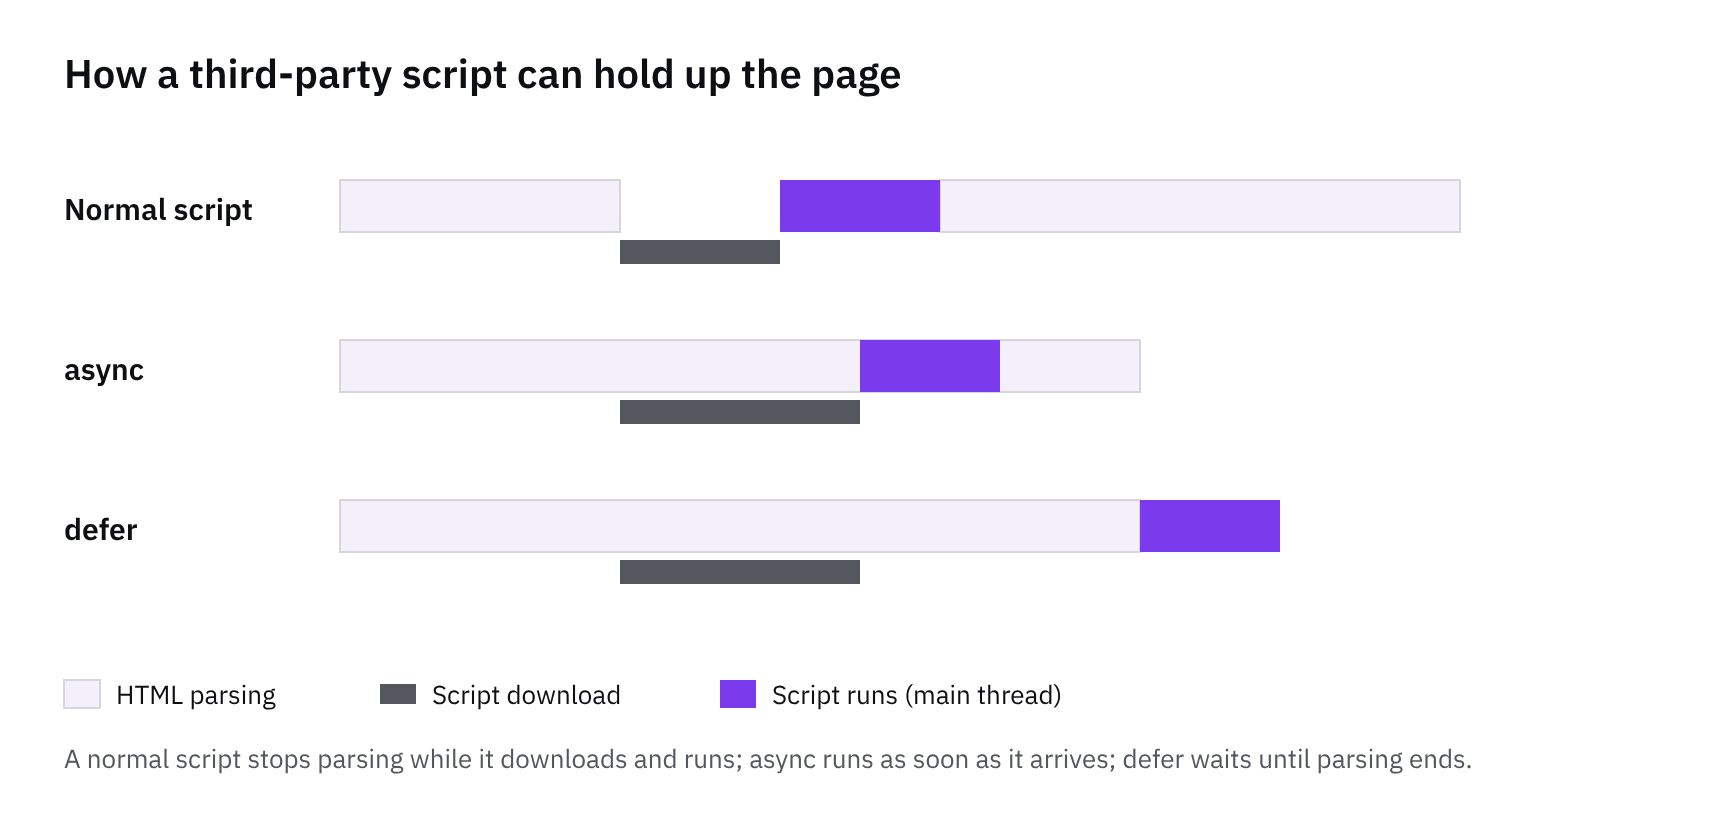
The common thread is the main thread, the single lane where the browser runs most JavaScript. Per web.dev's long tasks guide, any task over 50 milliseconds is a long task. JavaScript runs each task to completion, however long it takes, and the browser blocks interactions meanwhile. A click handler that calls five functions runs them as one task, so one fat handler becomes one long task. Script evaluation during load does the same: web.dev notes that parsing, compiling and executing a big script can block the main thread and delay responses. Iframes have their own main thread, but INP is reported at page level, so a slow interaction inside an embedded widget still counts against your page.
Shopify's performance guidance agrees: main-thread work, usually JavaScript, is what makes INP slow. On a store, much of that JavaScript doesn't come from your theme. Apps, review widgets, chat tools and tracking tags all add script work. This tends to hurt because each one looks small alone, but they compete for the same thread. So audit what loads. List every app and tag, ask who still uses it, and remove what's dead. Leftover code from uninstalled apps is a classic place to start.
Keep one thing separate: Liquid rendering time. Shopify's docs say client-side optimisations don't shorten the wait for Liquid-rendered content, but reducing Liquid rendering time does. So don't expect script trimming to fix a slow server response. Use Shopify Theme Inspector for Chrome to find the slowest Liquid lines, and treat that as its own job.
Find the slow interaction first
Start by finding which interaction is slow, because fixing the wrong one wastes a sprint. Chrome's field data (CrUX) can tell you whether a store has a responsiveness problem, but web.dev is clear that it can't tell you what caused it. For that you need real user monitoring (RUM), which records what shoppers experience and can attribute slow responses to particular interactions. web.dev recommends a RUM provider or your own setup for exactly this reason.
If you want to build a light version yourself, use the Event Timing API, which MDN describes as particularly useful for measuring INP. Create a PerformanceObserver that observes type event, and set buffered to true so you also get events recorded while the document was being built. Input delay is processingStart minus startTime, and handler time is processingEnd minus processingStart. Logging those two separately shows whether the main thread was busy before your code ran or whether your handler is the slow part.
By default, entries only appear when they last 104 ms or more. You can lower the threshold to 16 ms with the durationThreshold option, which helps when you want to see near-misses too. Durations are rounded to the nearest 8 ms, so don't read too much into small differences.
Then test the interactions shoppers actually use. On a Shopify store that usually means the variant picker, add to cart and the navigation menu, rather than whatever is easiest to click in a demo. Try them on a mid-range phone while the page is still loading, since that is when script work tends to get in the way.
Shopify's performance guidance says main-thread work, usually JavaScript, is what makes INP slow. It also says client-side tuning won't shorten the wait for Liquid-rendered content. For that, run the Shopify Theme Inspector for Chrome to spot the slowest Liquid lines. Think of it as the server-side counterpart: Event Timing shows what the browser struggles with, and the Theme Inspector shows where your templates are slow.
Fixes in your theme code
Start with the event callback. Keep only the work needed for the next visual update inside it, and defer everything else to a later task. web.dev puts it plainly: "Everything else can be deferred to a subsequent task." On a store, that means opening the cart drawer or showing the new variant comes first. Tracking, analytics pings and housekeeping come after. A click handler that calls several functions runs them all as one task, so five small functions still add up to one long task. Any task over 50 milliseconds counts as long, and a long task triggered by a click that blocks the visual response is measured as a poor INP, according to web.dev's long-task guidance.
To break up a long handler, yield to the main thread. The simple route is setTimeout with a zero delay, but that task joins the back of the queue, behind anything else waiting, including third-party scripts. scheduler.yield() is better where you can use it, because its continuation is prioritised and runs before other similar tasks. You can drop the scheduler-polyfill into your theme build so it works across browsers. Browsers without support won't get the prioritised continuation, but with the setTimeout fallback they still yield and stay responsive.
Here's a tip for the cart drawer. If the add-to-cart handler does tracking, analytics and UI updates in one go, update the UI first, then yield, then run the rest. This tends to help because the browser can paint the open drawer before the slower, invisible work begins. Also watch for layout thrashing: writing styles in JavaScript and then reading them in the same task forces the browser to recalculate layout on the spot. Batch your reads before your writes.
Two Shopify-specific habits help too. Use the Section Rendering API to fetch and update individual theme sections through Ajax, rather than reloading the whole page, as Shopify's performance guidance recommends. And go easy on preload. Shopify warns that overusing it competes with the browser's own prioritisation and can make pages slower, so reserve it for one or two resources the browser discovers late. One caveat: Shopify also notes that client-side optimisations don't shorten the wait for Liquid-rendered content. Only reducing Liquid rendering time does, and the Shopify Theme Inspector for Chrome shows you which Liquid lines are slowest.
Liquid or headless: what the numbers say
Headless is not automatically faster. In our sample, 71% of Liquid theme stores pass all Core Web Vitals, against 55% of headless ones. Yet the median INP is the same for both groups: 150 ms at the 75th percentile, comfortably inside Google's good threshold of 200 milliseconds or less (web.dev). Moving to a new front end didn't change how quickly pages respond to taps and clicks.
Stores passing all Core Web Vitals
Show the data
| Shopify, Liquid theme | 71% |
|---|---|
| Shopify, headless | 55% |
| Salesforce Commerce Cloud | 42% |
| Other and custom | 51% |
That fits what Shopify's performance guidance says: main-thread work, usually JavaScript, is what makes INP slow. So the JavaScript you ship drives responsiveness, whatever renders the HTML. The one place the groups differ is load time. Median LCP is 1.8 s for Liquid and 2.2 s for headless. The headless group is small, only 49 stores against 285 for Liquid, so treat the gap as a pointer, not a verdict.
If you build on Hydrogen, watch two things. This is reasoning, not something we measured. Hydration is the step where the browser attaches interactivity to server-rendered markup, and it tends to hurt because it runs as script work right when someone starts tapping. A large client bundle adds to that. Keep the bundle lean, and break up long handlers by yielding to the main thread, as the web.dev long tasks guide describes. On a Liquid theme, the same rule applies to app scripts and theme JavaScript.
What to do next
Start with field data, not a lab test. Check what real visitors experience at the 75th percentile, split by mobile and desktop, because that is the measure web.dev recommends. Then find the worst interaction. Chrome's field data can show whether you have a responsiveness problem but, as web.dev's INP guide says, it "can't tell you what caused the problem". A real user monitoring (RUM) tool can attribute slow INP to individual interactions. If you build your own, observe event timing with buffering switched on, and work out input delay from processingStart minus startTime.
Next, trim or defer app scripts. Scripts loading, parsing and compiling can create long tasks on the main thread, and web.dev notes that any task over 50 milliseconds counts as long. While one runs, taps and clicks wait. Remove apps nobody uses, load the rest later where you can, and remember that iframes count too, because INP is reported for the whole page. Then split long handlers. A click handler that calls five functions runs as one task. Do only what the next visual update needs, such as the cart count or the button state, and push the rest into later tasks. scheduler.yield() is a tidy way to do it, since its continuation runs before other queued work, such as third-party scripts. Where it isn't supported, a setTimeout fallback still yields, just without that priority.
Re-test after each change, and re-check after every app install. A new widget can quietly undo a month of tuning, so make the check part of your install routine. Two quirks help you read the numbers. INP ignores one highest interaction for every 50 on a page, so a single freak result on a long visit won't count. It also doesn't measure network fetches or UI updates from asynchronous work, only how long the next paint is blocked. So a slow API call isn't an INP problem, but a handler that freezes the screen while it waits is.
How we measured this
Of 418 stores we index that Chrome reports Core Web Vitals for, not the whole market.
Core Web Vitals and device mix come from the Chrome UX Report: real Chrome visits over the previous month, at the 75th percentile. Stores with too little Chrome traffic aren’t in it.
Platform and front end are detected from public HTML and headers; groups with fewer than 8 stores are left out.
Get the weekly digest
One email every Monday: the week’s new guides and articles, plus the Shopify deadlines coming up and what’s been announced. Free, and you can unsubscribe in one click.
Sources
- Interaction to Next Paint (INP) | web.dev · web.dev · accessed 22 Oct 2026
- Optimize Interaction to Next Paint | web.dev · web.dev · accessed 22 Oct 2026
- Optimize long tasks | web.dev · web.dev · accessed 22 Oct 2026
- https://shopify.dev/docs/storefronts/themes/best-practices/performance · shopify.dev · accessed 22 Oct 2026
- PerformanceEventTiming - Web APIs | MDN · developer.mozilla.org · accessed 22 Oct 2026
- Chrome UX Report (CrUX) on BigQuery · Google · accessed 22 Oct 2026
- Web Vitals · Google · accessed 22 Oct 2026
- How CommerceGeek measures · CommerceGeek · accessed 22 Oct 2026
AI-assisted, reviewed by Scott. Every claim is checked against the sources above.