

Speeding up stores on Salesforce Commerce Cloud
Stores on Salesforce Commerce Cloud in our sample pass Core Web Vitals less often than others; here is what usually holds them back and how to fix it on Shopify.

- Published
- 5 Nov 2026
- As of
- 24 Oct 2026
This guide is for merchants and developers weighing a move from Salesforce Commerce Cloud, or tuning a Shopify build. We look at where the gap shows up, which parts of a page load tend to cause it, and the fixes that matter most in Liquid themes and Hydrogen.
Where the gap shows up
Start with the pass rates. Of the Salesforce Commerce Cloud stores we measure, 42% pass all three Core Web Vitals. Shopify stores on a Liquid theme sit at 71%. The Commerce Cloud group is only 19 stores, so read that as a pointer, not a verdict. A couple of stores either way would move it noticeably.
Stores passing all Core Web Vitals
Show the data
| Shopify, Liquid theme | 71% |
|---|---|
| Shopify, headless | 55% |
| Salesforce Commerce Cloud | 42% |
| Other and custom | 51% |
Typical page load time (median LCP)
Show the data
| Shopify, Liquid theme | 1.8 s |
|---|---|
| Shopify, headless | 2.2 s |
| Salesforce Commerce Cloud | 2.4 s |
| Other and custom | 2 s |
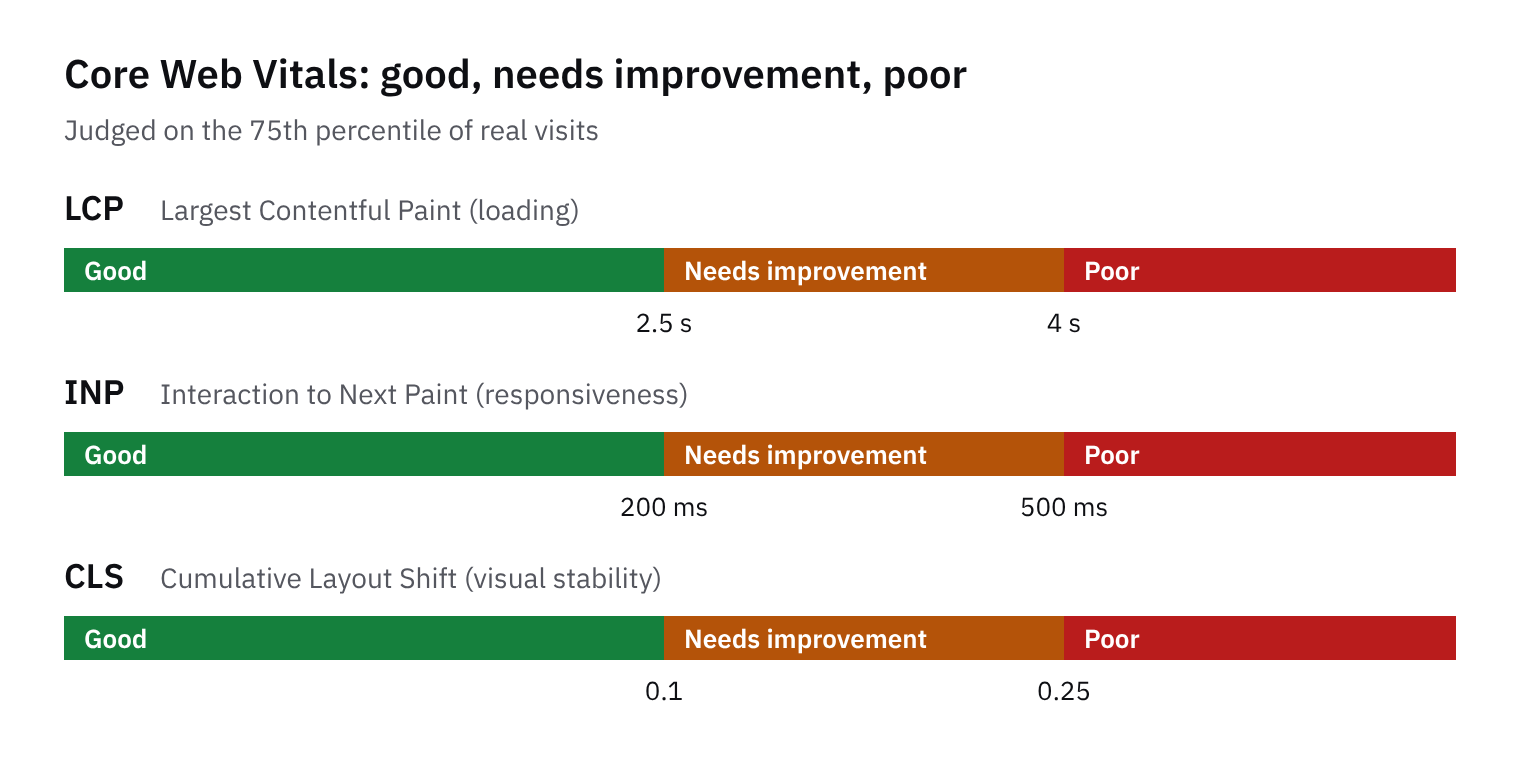
The medians tell a similar story. Commerce Cloud's median LCP (how long the biggest visible image or text block takes to appear) is 2.4 s. Web.dev says good is 2.5 seconds or less, so that sits just inside the line. The Liquid median is 1.8 s, which leaves a lot more room. Median INP (how quickly a page responds to taps and clicks) is 200 ms for Commerce Cloud, exactly on the good threshold of 200 milliseconds or less. Liquid stores sit at 150 ms.
Why does this matter if the medians are "good"? Passing is judged at the 75th percentile of page loads, so a store needs its slower visits to be fine too, not just the typical one. A median sitting right on the line leaves little headroom. Our practical tip: check your own 75th percentile figures, split by mobile and desktop, before you decide whether you're comfortably passing or only just.
What usually holds these stores back
We can't see inside these stores, so treat what follows as reasoning about likely causes, not a diagnosis. The typical Salesforce Commerce Cloud store in our data has a median LCP of 2.4 s, which is just inside the good threshold of 2.5 seconds that web.dev sets. Its median INP is 200 ms, which sits right at the good limit of 200 milliseconds. Median CLS is 0.05, comfortably under 0.1. With so little headroom on loading and responsiveness, a small regression on either tips a store into failing.
Start by splitting LCP into its four subparts, as web.dev's LCP guide does: time to first byte, resource load delay, resource load duration and element render delay. They add up to the full LCP time with no overlap. In a well-optimised page, the guide says TTFB and load duration should each be about 40%, and both delay parts under 10%. So if load delay or render delay is large, that's your clue. A slow first byte points to server work, redirects, distant visitors or query parameters that stop caching. A big gap between first paint and LCP suggests the main image or text is not in the initial HTML, for example because JavaScript builds it. That tends to be where hero images, carousels and client-rendered banners hurt. The fix is usually to put the LCP image in the markup, give it high fetch priority and never lazy-load it. Check the home page first, because web.dev notes it is often loaded cold and is often the slowest.
Responsiveness is mostly a main-thread problem. web.dev's INP guide lists script loading, parsing and compiling, timers and overlapping interactions as causes of input delay. It also notes that each iframe has its own main thread but its slow interactions still count against the page. That makes tag managers, chat widgets and review embeds prime suspects. Break long event handlers into smaller tasks, so only the visual update happens before the next frame, and defer the rest. Be careful with fixes, though: speeding up one subpart can simply move the time to another. A smaller image may not help LCP if render delay grows, so re-measure the breakdown after every change. Use field data rather than Lighthouse alone, since Lighthouse can't measure INP and CrUX is the better guide when the two disagree.
Fixing the server and delivery side on Shopify
On Shopify, the server side starts with Liquid. Shopify renders Liquid templates on the server for every page request, and Shopify's performance docs say the time spent executing your Liquid code directly determines Time to First Byte (TTFB). A slow server response holds back everything that comes after it. So if your pages feel sluggish before anything appears, look at your templates first. Before you change anything, run the Shopify Theme Inspector for Chrome. It shows which Liquid lines are slowest, so you fix real problems rather than guessing.
Keep pagination shallow too. The same docs say deeper pagination is resource-intensive and slows all requests on the server, and they advise staying under 25,000 objects. For a merchant, that means large collections need sensible filtering and navigation, not endless page-through lists. As a developer, you can often cut the work by limiting how much each loop pulls in and by not looping over large sets just to show a few items.
The delivery side is largely handled for you, which is a real difference if you are coming from a platform where you manage more of it yourself. Shopify's CDN is backed by Cloudflare, compresses files with Brotli and gzip, and uses HTTP/3 and TLS 1.3. It also sends Early Hints for render-blocking scripts and stylesheets on every storefront, with no theme changes. Reference assets through Liquid URL filters such as asset_url and image_url rather than hard-coding hosts, so Shopify serves the right one.
Our tip is to protect HTML streaming. Shopify's platform docs say it can send storefront HTML in two parts, so the browser starts on head resources before sections finish rendering. That can bring first paint and LCP earlier. Two things switch it off. Pages rendered from .liquid templates aren't streamed yet, so use JSON templates. And wrapping, filtering or relocating the content_for_header tag turns streaming off for every page using that layout, so leave it untouched. Make that a code review rule, since a well-meant tweak to the layout file is an easy way to lose the benefit without noticing.
Images, LCP and layout shift
Layout shift is the easiest of the three vitals to fix, and the gap shows. Shopify Liquid themes in our sample have a median CLS under 0.01, while Salesforce Commerce Cloud stores sit at 0.05. Both are inside the good threshold of 0.1 or less from web.dev, so this isn't what fails most stores. But it tells you the basics are cheap to get right on Shopify, and the image filters do most of the work.
Use image_tag with image_url wherever you output an image. Shopify's theme performance docs say these filters generate srcset attributes, add width and height to prevent layout shift, and serve images from the CDN. Hand-written img tags tend to lose one of those three, usually the dimensions. Then the browser can't reserve space and the page jumps as images arrive.
Be careful with the image that is your LCP element, usually the hero or the main product photo. The Shopify docs are blunt: never lazy-load it, because loading=lazy delays it until after layout completes. Mark it with fetchpriority=high instead, so the browser fetches it before other resources. Lazy-load everything below the fold, and keep the first image eager and high priority. web.dev's LCP guide splits LCP into four parts. If the image only starts loading late, the fix is in resource load delay, not in compressing it harder.
Preload is tempting here, but use it sparingly. The Shopify docs warn that overusing it competes with the browser's own prioritisation and can make pages slower. Reserve it for one or two resources the browser discovers late, such as a font or a background image set in CSS. Shopify already sends Early Hints for render-blocking scripts and stylesheets, so you don't need to preload those.
Our tip: reference every asset through asset_url, including in CSS. Shopify's platform docs explain that Liquid URL filters render the right asset host, so you never hard-code the CDN domain. They also say an image linked without the filter may not update for a day or more after you upload a new version. An image referenced directly in CSS has a static URL with no automatic asset version. Rename the stylesheet to a .css.liquid file or pass the image URL in as a CSS variable from the template, so the versioned URL is used. It's a small habit that stops stale images after a redesign.
Taming JavaScript and third-party scripts
Scripts are where most speed problems start. Shopify's own performance guidance says JavaScript, whether it comes from theme code or app scripts, runs on the main thread. It calls too much JavaScript, loaded at the wrong time or written inefficiently, one of the primary causes of poor INP and delayed LCP. Merchants feel this as a page that looks ready but ignores taps. Developers can start by using Chrome's Shopify Theme Inspector to see what the theme itself costs, then look at what apps add on top.
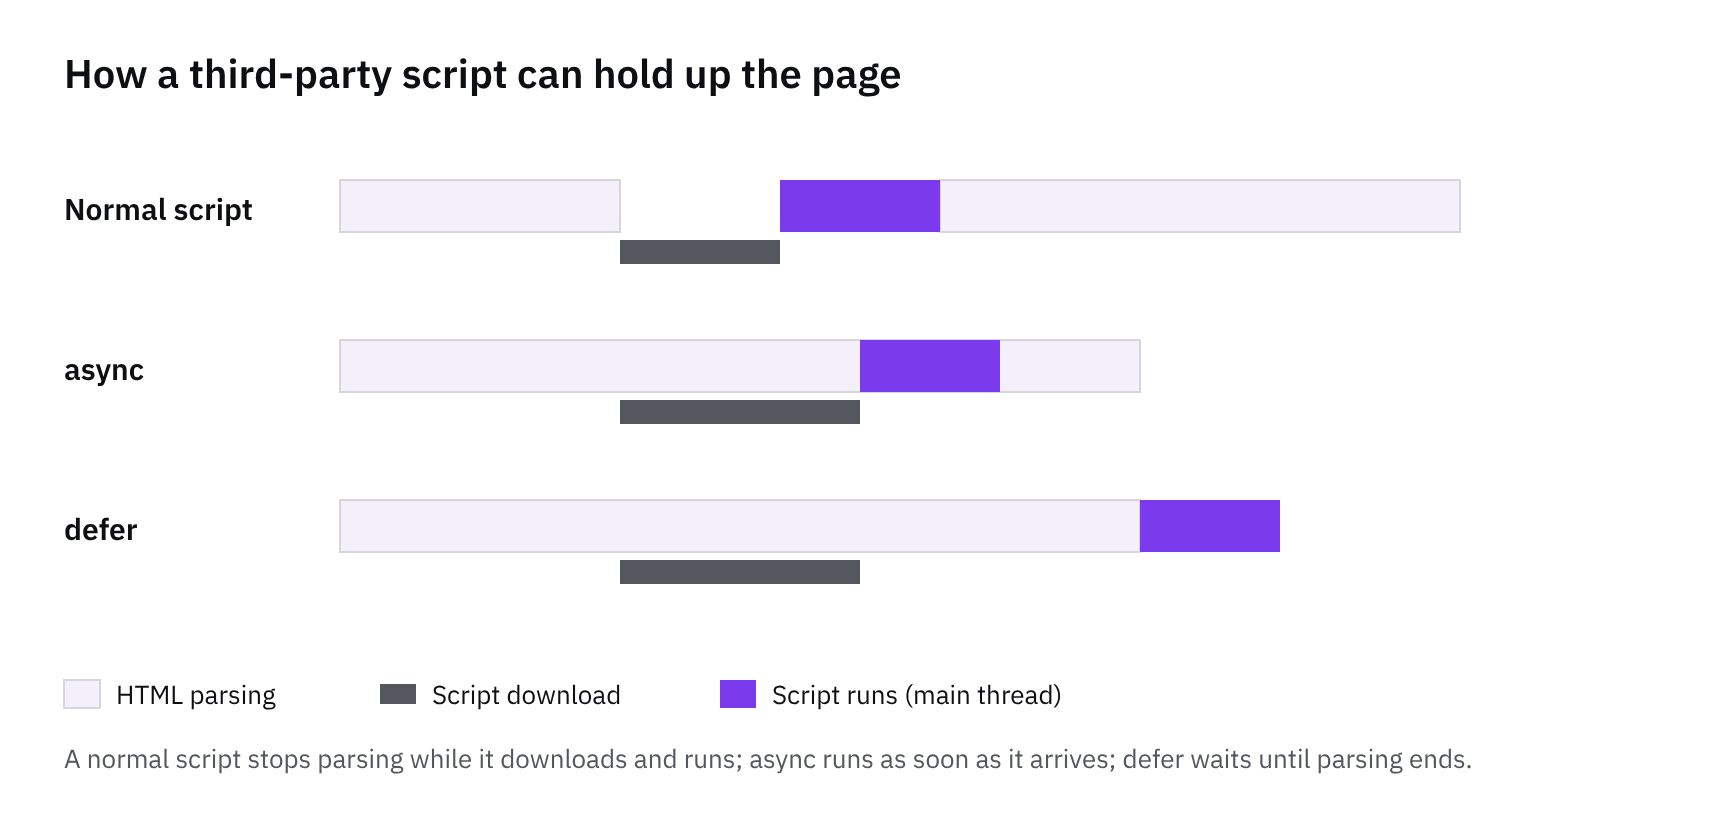
When you do find long tasks, break them up. The web.dev INP guide notes that setTimeout runs its callback in a new task, so a long task no longer blocks the main thread. It also points out that only the visual update has to finish before the next frame. Things like saving, counting or analytics calls can wait for a later task. Remember iframes too: each has its own main thread, and INP is reported at page level, so a slow chat or review widget in a frame still counts against you. Before adding another app, check what it loads and on which pages, and remove anything the store no longer uses.
This matters more as you move away from a Liquid theme. In our sample, Liquid theme stores and headless stores have the same median INP, 150 ms, but fewer headless stores pass all Core Web Vitals: 55% against 71%. INP isn't the whole story there, but it's a useful reminder. With Hydrogen or another custom front end, more of the JavaScript is yours to write, split and defer. Treat that as a reason to budget scripts from the start, not something to tidy up after launch.
Measure first, then what to do next
Start with field data, not a lab score. Field data is what real visitors on real devices and networks experienced. If Chrome User Experience Report (CrUX) data exists for your store, look at that first. web.dev's LCP guidance says that when Lighthouse and CrUX disagree, CrUX likely gives the more accurate picture. Lighthouse also can't measure INP at all, because a simulated load has no user input. Total Blocking Time is the lab proxy, so treat it as a pointer rather than a verdict.
CrUX tells you where you stand, not why. web.dev recommends setting up your own real-user monitoring, and the web-vitals JavaScript library is the easy way in. It's a small wrapper that measures each metric the way Google's tools report it. On Shopify, add it through a theme file or a small custom pixel, and send the results to whatever analytics you already use. Record the page type with each result, so you can compare home, collection and product pages rather than one blended number.
Check the home page early. It's often loaded cold by new visitors with nothing cached, so web.dev notes it is often the slowest page on a site. Then work in three steps. Baseline: note LCP, INP and CLS at the 75th percentile, the point where passing is judged. Fix the biggest LCP subpart: web.dev splits LCP into TTFB, resource load delay, resource load duration and element render delay, and a well-optimised page is roughly 40% TTFB, 40% load duration, with each delay under 10%. Re-measure after each change, because fixing one subpart can just shift time to another. Then repeat.
How we measured this
Of 418 stores we index that Chrome reports Core Web Vitals for, not the whole market.
Core Web Vitals and device mix come from the Chrome UX Report: real Chrome visits over the previous month, at the 75th percentile. Stores with too little Chrome traffic aren’t in it.
Platform and front end are detected from public HTML and headers; groups with fewer than 8 stores are left out.
Tools in this article
Which of the stores we index use them, by platform, sector and over time.
- Cloudflare on 677 stores
Get the weekly digest
One email every Monday: the week’s new guides and articles, plus the Shopify deadlines coming up and what’s been announced. Free, and you can unsubscribe in one click.
Sources
- Performance best practices for Shopify themes · shopify.dev · accessed 22 Oct 2026
- The Shopify platform · shopify.dev · accessed 22 Oct 2026
- Web Vitals | Articles | web.dev · web.dev · accessed 22 Oct 2026
- Optimize Largest Contentful Paint | Articles | web.dev · web.dev · accessed 22 Oct 2026
- Optimize Interaction to Next Paint | web.dev · web.dev · accessed 22 Oct 2026
- Chrome UX Report (CrUX) on BigQuery · Google · accessed 22 Oct 2026
- How CommerceGeek measures · CommerceGeek · accessed 22 Oct 2026
AI-assisted, reviewed by Scott. Every claim is checked against the sources above.