

Why big retailers struggle with Core Web Vitals
Big retailers pass all Core Web Vitals less often than other stores in our sample; here is what tends to hold them back and the Shopify fixes that help.
- Published
- 4 Nov 2026
- As of
- 24 Oct 2026
Of the big retailers we measure, 36% pass all three Core Web Vitals, against 57% of all stores. The group is small, so treat it as a pointer, not a verdict. This guide covers the usual suspects and the practical fixes for merchants and developers on Shopify.
What passing actually means
Core Web Vitals are three measures of how a page feels. Largest Contentful Paint (LCP) is loading: how long until the biggest image or text block appears. The web.dev guidance says a good LCP is 2.5 seconds or less. Interaction to Next Paint (INP) is responsiveness: how quickly the page reacts when someone taps or clicks, with 200 milliseconds or less counting as good. Cumulative Layout Shift (CLS) is visual stability: how much content jumps around, with 0.1 or less counting as good.
Stores passing all Core Web Vitals, by sector
Show the data
| Fashion | 56% |
|---|---|
| Beauty | 61% |
| Home | 56% |
| Food and drink | 74% |
| Tech accessories | 64% |
| Pets | 58% |
| Big retailers | 36% |
| Handbags | 59% |
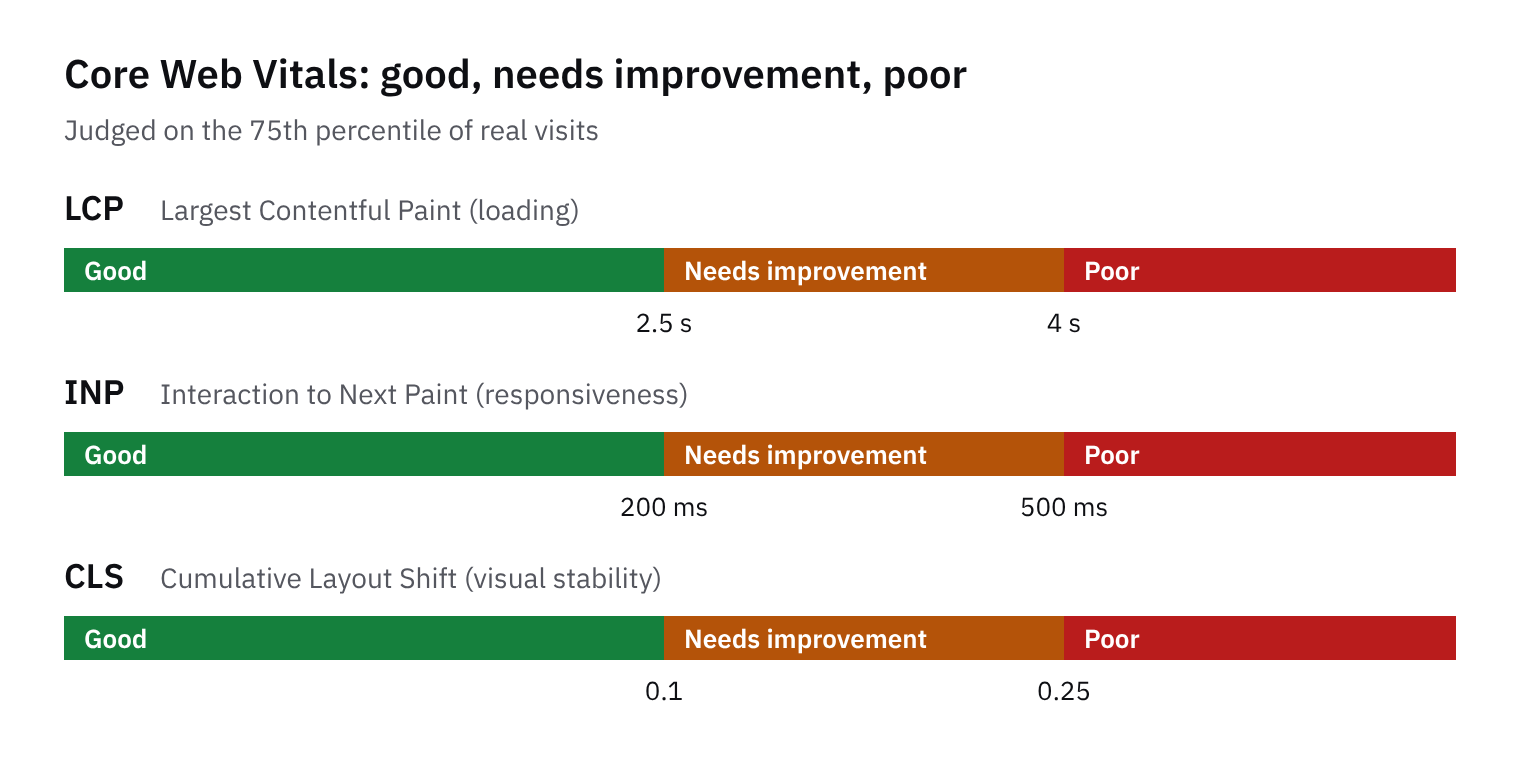
A page passes only if it meets the targets at the 75th percentile for all three. In plain words, three out of four visits need to be good, not the average visit. One weak metric fails the whole page, so a store with a fast hero image and a jumpy layout still fails. That is part of why only 36% of the big retailers we measure pass all three.
What counts is field data: real visits, collected by the Chrome User Experience Report. Lab tools like Lighthouse load a page in a simulated setup with no user, so they can't measure INP at all. Total Blocking Time is only a lab stand-in. web.dev also notes that CLS in Chrome's data covers the whole life of the page, including shifts as people scroll, while lab tools typically look at the initial load. So a green lab score can sit next to a failing store.
Our tip: open PageSpeed Insights and read the real-user section first, before the lab diagnostics. It tells you which of the three metrics is actually failing for your visitors, and that decides where to spend your time. Once you know, set up your own real-user monitoring, because Chrome's data alone won't show you what caused a regression.
Why big retailers find it harder
We can't measure why big retailers pass less often, so treat what follows as reasoning, not a result. The pattern is clear enough in our data: 36% of the big retailers pass all three Core Web Vitals. Their phone traffic is heavy too, with a median of 70% of Chrome visits on phones. Phones are where slow servers and busy main threads hurt most. The big-retailer group is small, only 11 stores, so read it as a hint rather than a rule.
Share of visits on phones, by sector
Show the data
| Fashion | 61% |
|---|---|
| Beauty | 70% |
| Home | 60% |
| Food and drink | 62% |
| Tech accessories | 66% |
| Pets | 67% |
| Big retailers | 70% |
| Handbags | 74% |
Size tends to bring a few things that stack up. Catalogues are bigger, and Shopify's performance guidance says Liquid loops nested across products, variants or options grow quadratically with catalogue size. A theme that feels fine on a small catalogue can be slow on a large one, and the same guidance calls this the most common cause of high TTFB (time to first byte, the wait before anything arrives). Then come the extras. More apps, more tags and more teams editing pages mean more JavaScript on the main thread. Shopify's docs also warn that moving product info, hero content or nav into client-side JavaScript delays LCP. Embeds matter as well: web.dev's INP guide notes that each iframe has its own main thread, and INP counts slow interactions inside iframes at page level. A review widget or chat embed can drag down a page you thought you owned.
Here's the tip: audit what has been added over time, and write down who owns each addition. List every app, tag, embed and homepage section, and ask what it's for and who would notice if it went. Anything without an owner is a candidate to remove or defer. Check the loops in your Liquid too, especially any that nest across products and variants. This tends to help because performance rarely breaks in one big change. It slips through many small additions that nobody was asked to justify.
Fixing loading: LCP and server response
Start by breaking LCP into its four subparts: time to first byte, resource load delay, resource load duration and element render delay. web.dev's LCP guide explains that a fix to one part can simply shift the saved time to another, for example when the LCP element stays hidden until JavaScript finishes loading. It also says a quick fix to a single part rarely makes a meaningful difference. So measure the split on your slowest templates first, then change one thing at a time. Home pages are worth checking early, since web.dev notes they are often loaded cold and tend to be the slowest pages.
On the front end, Shopify's theme performance docs give a short list. Never lazy-load the LCP image. Anything visible in the first viewport should load eagerly, because lazy-loading delays it until after layout completes. Add fetchpriority high to that one image so the browser fetches it before other resources; Shopify calls it a one-line change with measurable LCP improvement. Drop fade-in and reveal animations on the hero, as they delay the LCP event even after the image has downloaded. Keep hero content, product info and navigation out of client-side JavaScript too, because it delays LCP. Use preload sparingly. Shopify says to reserve it for one or two resources the browser finds late, since overuse competes with the browser's own prioritisation and can slow pages down.
Then look at the server. Shopify renders Liquid on every page request, so the time your code takes to run directly sets TTFB. web.dev warns that a high TTFB can make a good LCP hard or even impossible. The docs name loops nested across products, variants or options as the most common cause, because they grow quadratically with catalogue size. A theme that feels fast on a handful of products can crawl on a large catalogue, which is where big retailers live. Flatten those loops, or fetch the data once and reuse it. Also keep pagination under 25,000 objects, as deeper pagination slows all requests on the server.
Fixing responsiveness: INP and third-party scripts
Responsiveness is where big retail stores often pay for years of accumulated scripts. INP (Interaction to Next Paint) looks at how long the page takes to react to taps and clicks across a whole visit. web.dev says a good INP is 200 milliseconds or less. One cause it names is script evaluation: parsing, compiling and running JavaScript during page load can create long tasks on the main thread, and those tasks delay the browser from responding when someone taps. On phones, which carry most visits for the big retailers we measure, that delay is easier to feel.
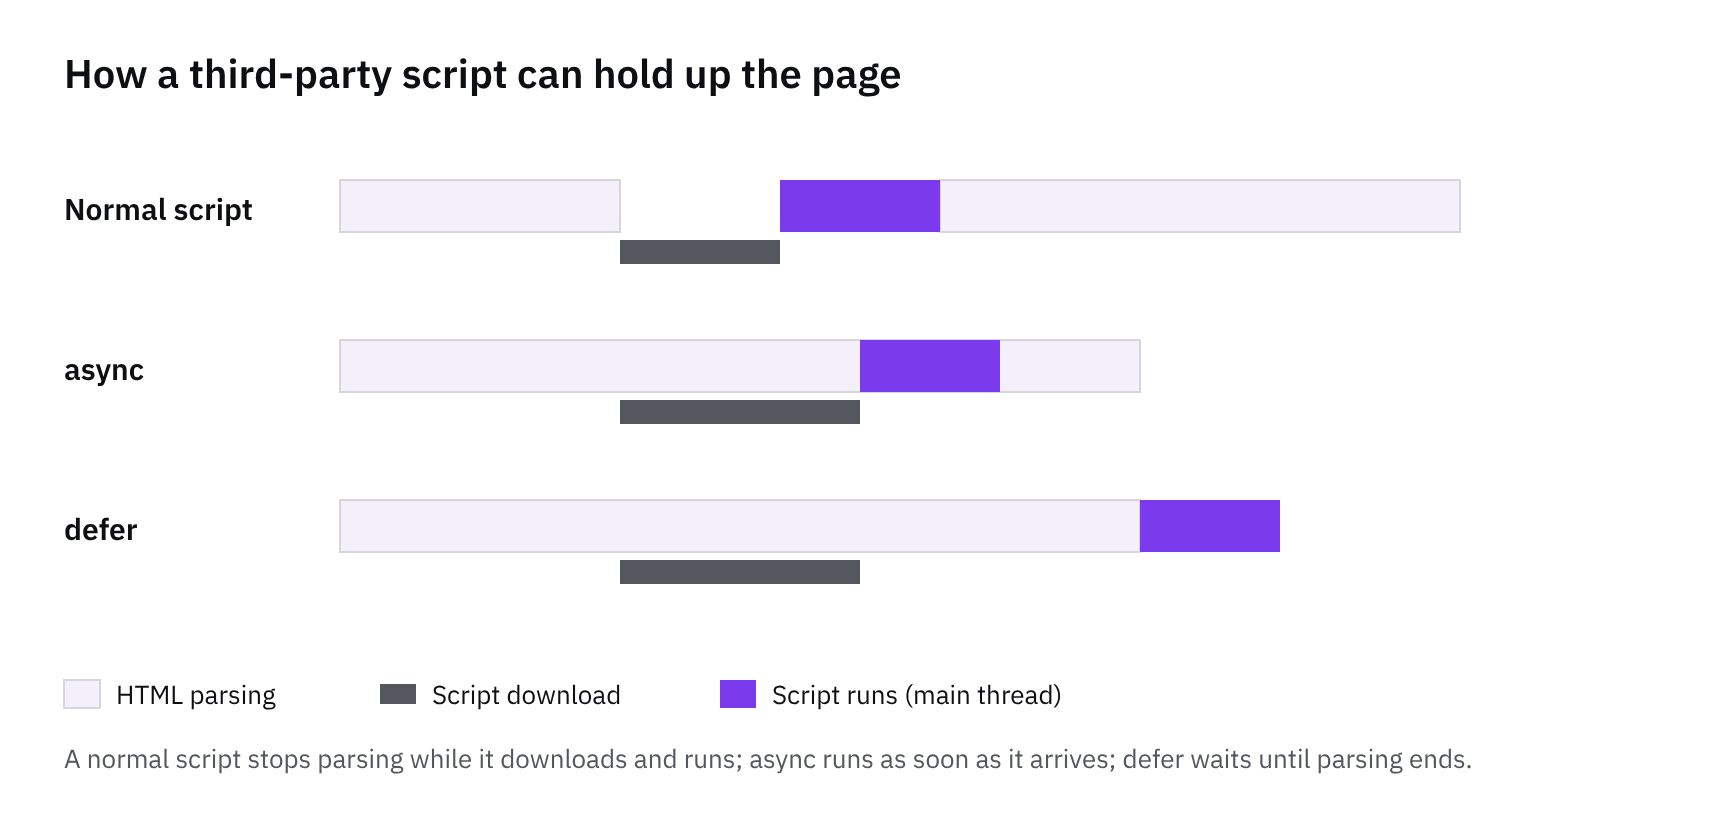
Start with an audit of what runs. List your review apps, tag managers, chat and popup widgets, and ask what each one earns. Remove what nobody uses. Then load what you can later, so scripts are not competing with the first interaction. Where an app is needed, prefer one built with theme app extensions and app blocks. This tends to help because its code can load only on the pages where the block is placed, rather than on every page. Watch iframes too: web.dev notes that each iframe has its own main thread, and INP is reported at page level, so a slow interaction inside an embedded widget still counts against you.
Your own code matters as well. If a click handler does everything at once, split it. web.dev suggests breaking work into separate tasks, for example with setTimeout, because the callback runs in a new task. Only the visual update has to finish before the next frame. Things like saving or tracking can wait. Here is a practical tip: after you uninstall an app, check the theme for leftover code. Snippets, script tags and asset references often stay behind and keep running for an app that is no longer there. Delete them and test again.
Measurement needs care. Lighthouse cannot measure INP, because it loads pages without a user. Total Blocking Time is only a lab proxy, so a good score there does not prove real visitors get fast responses. Chrome field data shows the result, but web.dev notes it often lacks the context needed to diagnose problems. Google strongly recommends setting up your own real-user monitoring, and the web-vitals JavaScript library is the simple way to start.
Fixing stability: CLS
CLS, or Cumulative Layout Shift, measures how much visible content jumps around and how far it moves. The usual culprits, according to web.dev's CLS guide, are images without dimensions, ads, embeds and iframes without dimensions, dynamically injected content, and web fonts. Big retail pages tend to have all of those at once, which is why this metric is worth a proper look.
Start with media. web.dev says to always put width and height attributes on images and video, or reserve the space with CSS aspect-ratio. This works because modern browsers use those attributes to work out an image's default aspect ratio before it loads. In a Shopify theme, check that your Liquid image output passes both dimensions through, including in cards, banners and merchant-editable sections. For embeds, ads and anything injected after load, give the container a fixed space up front, so a late arrival fills a gap rather than pushing the page down. Review banners, review widgets and promo bars the same way. Web fonts are the other cause on that list, so treat font loading carefully and check that your fallback font does not reflow the text when the real one arrives.
Remember that Chrome's field data measures CLS across the full life of the page, not just the initial load that lab tools typically test. web.dev points out that CLS often happens as people scroll, when lazy-loaded content arrives with no space reserved for it. So a clean lab run can sit alongside a failing field result. Shifts within 500 milliseconds of a tap or click are treated as expected and excluded, so the ones that hurt are those nobody asked for.
Here's a tip that costs nothing: open the store on a phone and scroll the whole page slowly, from header to footer. Watch for jumps as images, recommendation rows and embeds arrive. Anything that moves is missing reserved space. Then check PageSpeed Insights, which shows real-user CLS in one section and lab load CLS in another, so you can see whether the two disagree.
Measuring and what to do next
Start by measuring your own visitors. Chrome's public data is handy for a first look, but it doesn't give the detail of each page view, which is why Google strongly recommends that sites set up their own real-user monitoring. The web-vitals JavaScript library is the easy way in. It's a small, production-ready wrapper that measures each metric the way Google's tools report it. In a Shopify theme, load it once from your theme layout and send the results to your analytics tool, tagged with the template name. That tag matters: it lets you see whether the home page, a collection or a product page is the problem. Lab tools alone won't settle it, because Lighthouse can't measure INP without a user. Total Blocking Time is only a proxy.
Next, pick the templates that matter: home, collection and product. Fix one metric at a time, so you can tell which change did what. For loading, Shopify's performance guidance points to the usual suspects: lazy-loading the main image, reveal animations, and nested Liquid loops, which it calls the most common cause of high TTFB. For responsiveness, look at script work during load, since long tasks delay the browser's response to taps. Then decide on architecture. A well-built Liquid theme is often enough, and Shopify's theme help covers structure and customising. Hydrogen suits teams who want full control of rendering, but it moves more work into your hands, and Shopify warns that pushing hero content into client-side JavaScript delays LCP.
The habit that protects all of this: make a performance check part of every app install and every theme change. Test the key templates before and after, and compare your monitoring afterwards. This tends to help because slowdowns usually arrive one small addition at a time, and a check at the door is far cheaper than hunting for the cause months later. Remember that a page only passes when all three metrics meet their targets at the 75th percentile, so one slow template can hold back the whole result.
How we measured this
Of 543 stores we index that Chrome reports figures for, not the whole market.
Core Web Vitals and device mix come from the Chrome UX Report: real Chrome visits over the previous month, at the 75th percentile. Stores with too little Chrome traffic aren’t in it.
Sectors are our own labels from the curated store list.
Get the weekly digest
One email every Monday: the week’s new guides and articles, plus the Shopify deadlines coming up and what’s been announced. Free, and you can unsubscribe in one click.
Sources
- Web Vitals | Articles | web.dev · web.dev · accessed 22 Oct 2026
- Optimize Largest Contentful Paint | Articles | web.dev · web.dev · accessed 22 Oct 2026
- Optimize Interaction to Next Paint | web.dev · web.dev · accessed 22 Oct 2026
- Optimize Cumulative Layout Shift | Articles | web.dev · web.dev · accessed 22 Oct 2026
- https://shopify.dev/docs/storefronts/themes/best-practices/performance · shopify.dev · accessed 22 Oct 2026
- Shopify Help Center | Shopify themes · help.shopify.com · accessed 22 Oct 2026
- Chrome UX Report (CrUX) on BigQuery · Google · accessed 22 Oct 2026
- How CommerceGeek measures · CommerceGeek · accessed 22 Oct 2026
AI-assisted, reviewed by Scott. Every claim is checked against the sources above.